

Industry Overview: Titanium Oxide (TiO2) in 2025
This analysis will help you better understand the competitive position of key TiO2 producers globally (KRO, TROX, CC, LB Group)

A number of TiO2 producers are trading at historically low price to book ratios. I decided to take a deeper look into these companies in order to see if there are any discounted stocks. In order to value those companies I had to develop a deeper understanding of the industry and underlying commodity, this article is the result of that research.
Executive Summary of Industry
Buyers of TiO2 have inelastic demand, and demand is lower than usual, suggesting a future upswing in demand.
Producers of TiO2 are essentially refiners of Titania ore, 50-77% of production cost is the cost of ore.
The feedstock market for TiO2 pigments made using chloride production (rutile) is tight with increasing depletions and little capacity coming online, providing benefits to titania miners and vertically integrated titania producers (TROX).
Chinese producers are low cost producers with significant competitive advantages, they have been the only producers to add capacity since 2014 and have significant excess capacity today. However, western nations have protected their markets with antidumping measures.
The entire TiO2 market has excess production capacity, reducing pricing power for the industry. However there has been global excess capacity since 2015 and producers have maintained profitable margins throughout that time.
If you believe that Chinese production can be protected against or mitigated in the west, then expect western producers to maintain historically similar utilization and margins over time. (Miners may be the more interesting opportunity.)
If so, all global titanium oxide producers (KRO, CC, TROX) appear to be fairly priced.
Background on the TiO2 industry
TiO2 is a quality of life product, so its demand closely tracks GDP.
The titanium oxide industry has 3 major market segments: ore miners, titanium oxide producers and end users. I will go over these starting with the last and working my way to miners. Overall, ore miners and titanium oxide producers are highly consolidated with increasing consolidation over recent years, while end users are fragmented.
This is a low margin, mature industry with a history of bankruptcies: TROX in 2009 (largely due to litigation liabilities inherited in its spin off), and Venator in 2023 (highly leveraged at peak cycle 2021, before industry downturn in 2023).
The market can be divided into 2 geographic segments: The West and China, with Chinese producers consistently outperforming analyst expectations. The west has recently implemented protectionist measures, further splitting the market.
The market also contains varying qualities of TiO2 in a gradient from low quality pigments produced using sulfate and unconcentrated ore to high quality pigments using chloride and concentrated ores.
The market contains unintegrated producers like KRO and CC who are effectively price takers of ore miners, limiting their profitability and vertically integrated producers like TROX who are not limited by this.
The industry has significant global excess capacity, a key bottleneck to production appears to be limited feedstocks.
End uses of TiO2
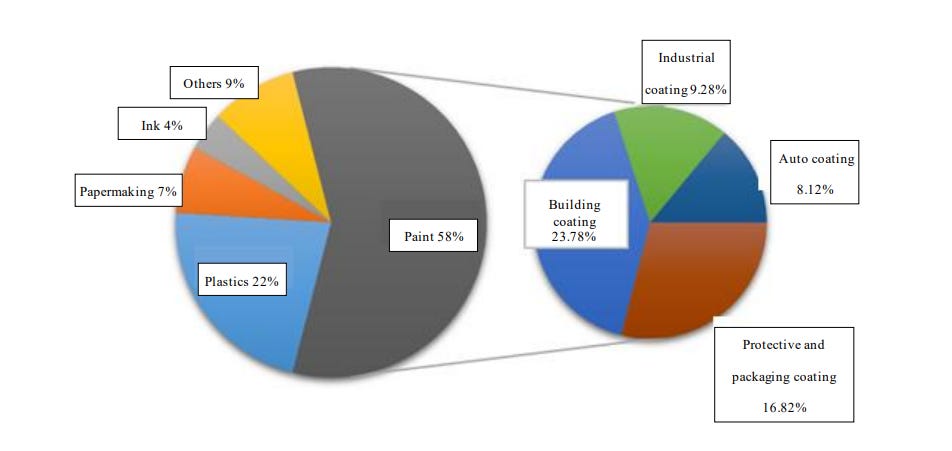
Titanium Oxide (TiO2) is a pigment used in practically every product that comes in white - paints, papers, plastics and more. Making it a "quality of life" product.
Source: LB Group annual report.
https://www.lomonbillions.global/wp-content/uploads/2025/06/LB-Group-2024-Annual-Report-ENGLISH.pdf
Production Methods
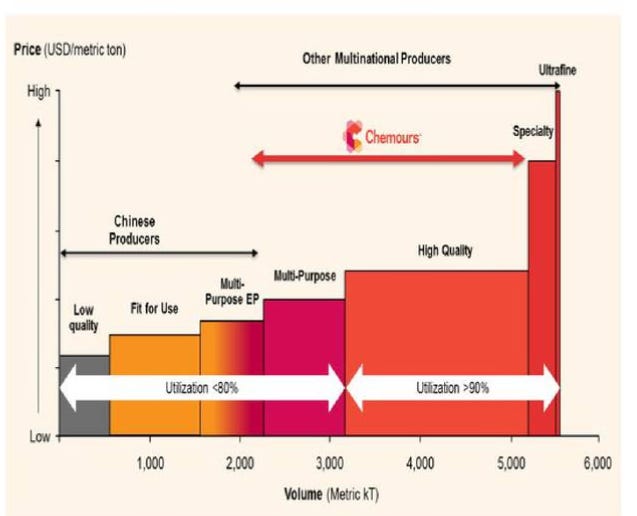
Quality and price of TiO2 varies greatly depending on chemical quality and granule size. Per Chemours "Quality and performance of products differ considerably across market segments and applications." Source: https://seekingalpha.com/article/4007885-chemours-company-cc-ceo-mark-vergnano-hosts-september-investor-meetings-slides
TiO2 is produced using two different production processes: chlorination and the sulfate method. The chlorination process is simpler, uses less energy, and produces TiO2 of higher quality and price.
1) The Sulfate Method:
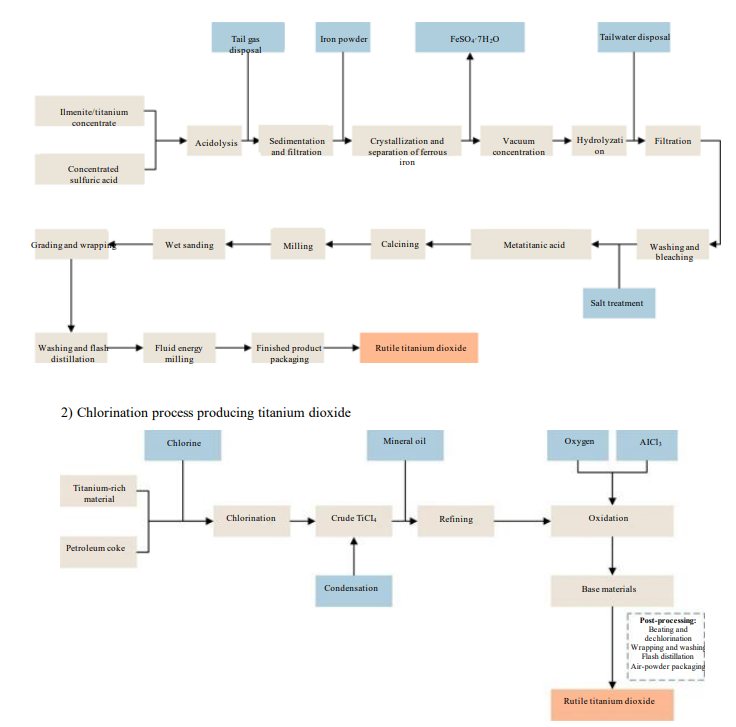
Production methods for TiO2.
Source: LB Group annual report.
https://www.lomonbillions.global/wp-content/uploads/2025/06/LB-Group-2024-Annual-Report-ENGLISH.pdf
Some producers like LB Group are able to use byproducts of the production process for other materials like lithium ion batteries. Which offers them an advantage.
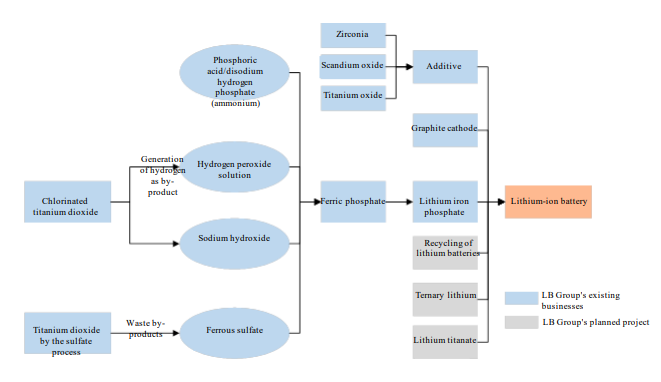
Waste products of the TiO2 process.
Source: LB Group annual report.
https://www.lomonbillions.global/wp-content/uploads/2025/06/LB-Group-2024-Annual-Report-ENGLISH.pdf
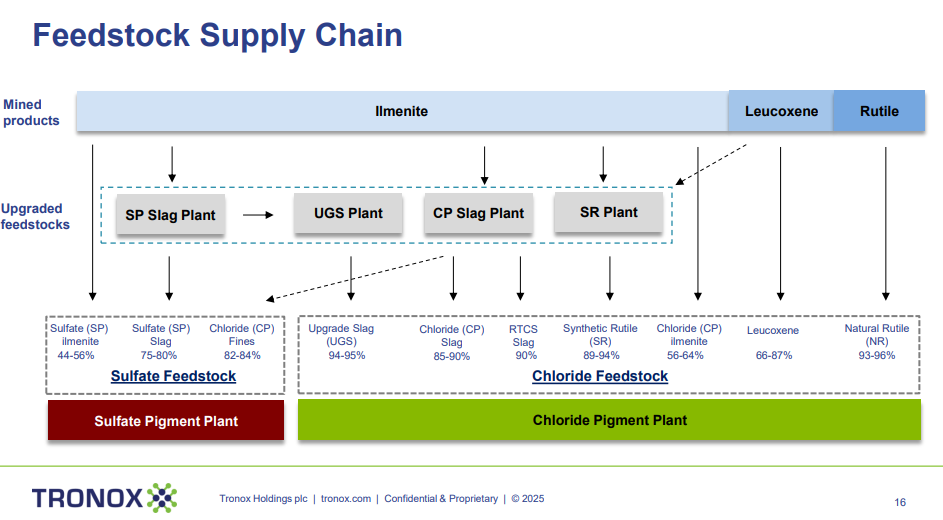
TROX is able to upgrade fuel stocks to increase the range of feedstocks for its production processes: TROX investor presentation. https://s1.q4cdn.com/960380961/files/doc_presentations/2025/May/30/Tronox-Investor-Presentation-2025.pdf
Overall, the industry is capital intensive and generally low returns on assets ~ 5%. It appears to me that KRO is a mature commodity-like industry with slow growth.
Consumers/Buyers of TiO2
Demand for TiO2 is relatively inelastic with no signs of demand destruction
TiO2 has been used commercially since 1916, and has no substitutes that match it in its opacity. It is unlikely to be disrupted by new entrants, but western producers face stiff competition from LB Group - the low cost producer.
In the Q3 2011 earnings call when TiO2 was priced at all time highs. KRO management has pointed out a few interesting aspects of the market. They made these comments when TiO2 was priced at the top of a cycle. At that time they noted that customers need their product so there is little price sensitivity. There is no real substitute for TiO2, so TiO2 consumers are able to pass the costs on to their consumer
"So the idea that customers can either pass it through or absorb it or make up the difference on their margins in a different way is very real… prices have to go up …They would prefer this – a lot of our customers won’t like this statement, but I think they’d prefer a higher price than a lack of availability…The volume is whatever it’s going to be and it’s not as price sensitive…TiO2 products are used worldwide. It’s an easy product to ship, low cost to ship. It packs very easily."
- Steve Watson, Kronos CEO, 2011
However in Q3 in 2017, Michael McGarry CEO of major paint producer PPG did suggest that there was significant thrifting in 2011. Warning pigment producers of that fact.
"I would tell you, TiO2 is up more than we expected. I’ve cautioned some of the TiO2 suppliers, don’t forget 2011, where they -- there was demand destruction." -Michael McGarry
I take this to mean that demand destruction is possible at extreme prices, either through the use of extenders or some similar method, but this is uncommon historically.
Pent up demand for TiO2 is apparent.
KRO management has said that demand for TiO2 is correlated with activity generally. (KRO 10-K) So we can expect long term growth in line with global GDP 2-3%.
In the US and EU, consumption of TiO2 has lagged GDP. Suggesting pent up demand for TiO2 in the west. This appears to be related to the economic and housing slowdown due to higher interest rates.
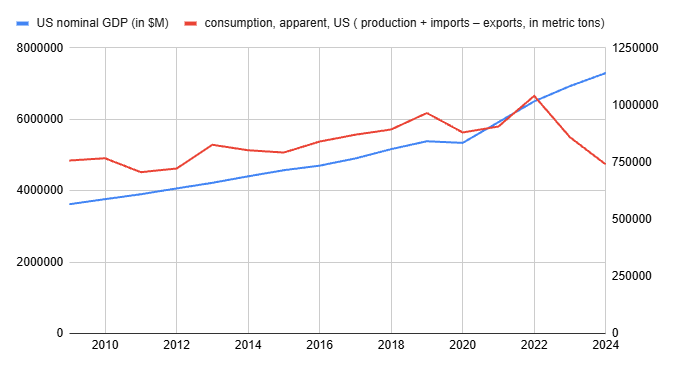
Left Axis, Blue Line = GDP in $ Mn according to US FRED.
Right Axis, Red Line = Consumption apparent, US in metric tons, according to USGS, equals production + imports - exports.
Over this period, US GDP has gone up 56%, while apparent consumption of TiO2 has gone down 7%.
Europe presents a similar story:

Right Axis, Black Line = nominal GDP in EUR Mn according to EUROSTAT. Left Axis, Purple line = Consumption apparent, EU in metric tons, according to EUROSTAT's Production figures and Trade figures , equals production + imports - exports.

All figures in metric tons. Data from EUROSTAT's Production figures and Trade figures
Source: https://www.pricepedia.it/en/magazine/article/2024/06/24/the-case-of-titanium-between-abundance-and-criticality/
The trough in apparent consumption in 2010-2014 is due to greatly decreased imports from China. Considering that TiO2 industry profits peaked in 2010-2014, and 2017-2018, the biggest levers of profitability in the industry appear to be increased domestic demand and reduced foreign supply.
Producers (Refiners) of TiO2.
Competition in TiO2
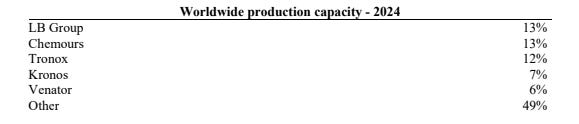
Market share of the top 5 TiO2 producers.
Source: KRO 10-K
Chemours is an American company that was spun off from Dupont in 2015. They specialize in TiO2, but have other operating divisions like refrigerants, and significant legal liability due to historic Dupont PFAS production. 44% of revenues come from TiO2.
Tronox is an American company that is vertically integrated in its TiO2 production, with mines providing resources for both the sulfur and chlorine methods. Tronox (mostly through its mining operations) produces products other than TiO2. 77% of revenues come from TiO2.
LB Group CO. LTD is Chinese, vertically integrated and the lowest cost producer. 66% of revenues come from TiO2.
Venator is based in the UK and recently sold a 50% interest in their american plant to Kronos. Venator went bankrupt in the 2023 downturn. 100% of revenues come from TiO2.
Kronos specializes in TiO2 and also owns an ilmenite mine to fuel its sulfate process. 100% of revenues come from TiO2.
TiO2 production and production processes.
TiO2 made using the sulfate method requires: Ilmenite (a less rich titania ore) or titania slag (made from ilmenite), sulfuric acid and energy. Most TiO2 producers have some level of vertical integration with ilmenite production (KRO is completely sustained by owned ilmenite mines), so I don't focus on the behavior of Ilmenite producers in this write up.
TiO2 made using the chlorination process requires: chloride ilmenite, or to a lesser extent, leucoxene, slags, and natural and synthetic rutiles, in addition to chlorine, calcined petroleum coke, and energy.
Kronos and Venator are the only pure play TiO2 producers. Of their tio2 production, TROX, KRO and CC are primarily TiO2 producers using the chloride process method.
TiO2 as a percent of total revenue and Chloride process production as a percent of total TiO2 production. Source.
Most of the major producers heavily use the chlorination process, while LB Group mostly uses the sulfate process.
Production Curves of TiO2 producers
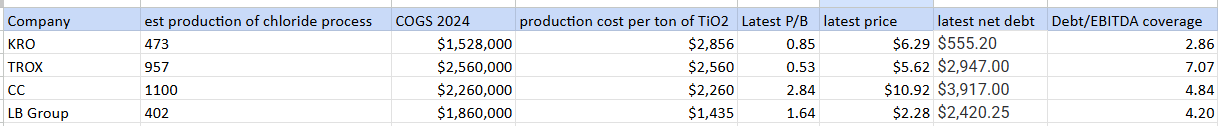
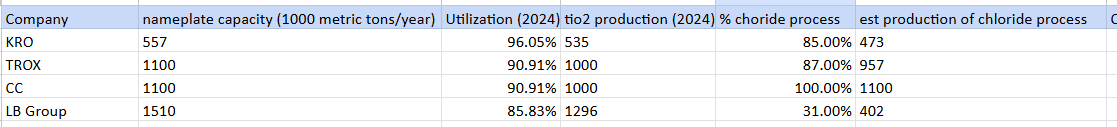
The cost production curve of the industry in 2024. COGS is for the TiO2 segment of each company. To arrive at the production cost per ton of TiO2 (using the chloride method), we multiply segment COGS by the percent of production volume using the chloride method. LB Group appears to have a competitive advantage over the rest.
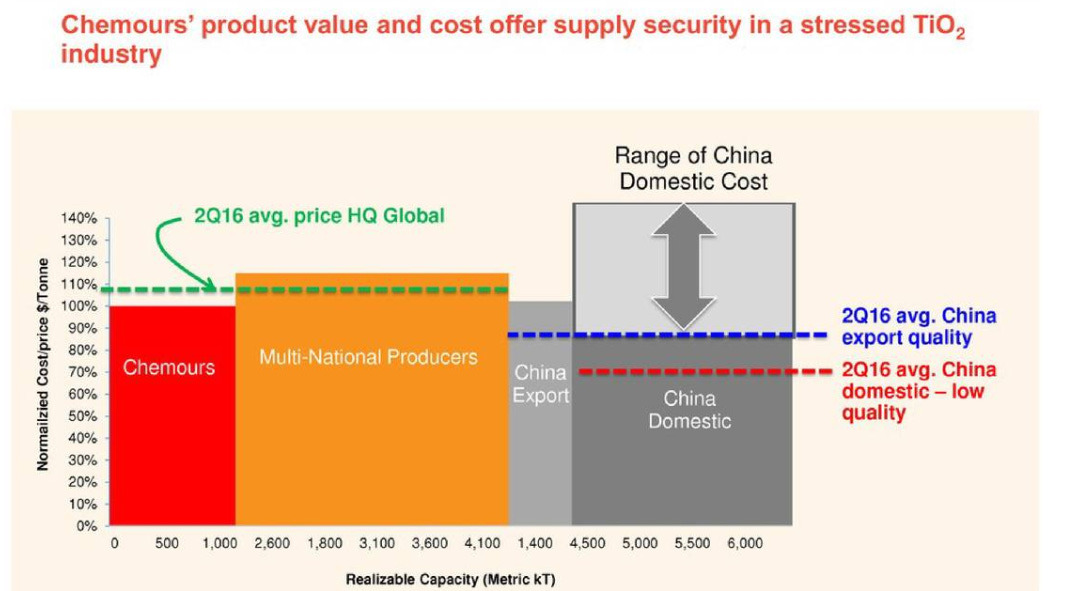
Chemours investor presentation. Highlighting Chinese cost advantages. Source. https://seekingalpha.com/article/4007885-chemours-company-cc-ceo-mark-vergnano-hosts-september-investor-meetings-slides
Refiners Production Capacity

CC 10-K. TiO2 producers globally have about 25% excess production capacity. Typically a bad sign for refiner pricing power.

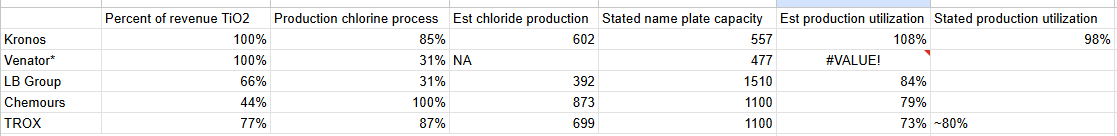
KROX states its utilization was at 98%, Venator states 81%, LB Group states 79%, CC and Trox were backed into.
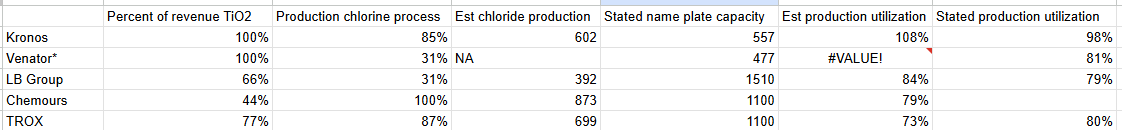
Backing into Chloride capacity utilizations. Production estimates were arrived at by taking the stated revenue * chloride process percent / USGS titanium oxide price. Utilization estimate takes the production estimate divided by the nameplate capacity * chlorine process percent. For Venator this was using 2023 annual report data and subtracting Lake charles chloride process 75k production, and Duisburg sulfate process 50k production to arrive at pro forma 2024 production capacity and process split. Source.
In the coming years, LB is adding some capacity while other competitors are reducing their production. Meaning that near term TiO2 supply in the west is likely to be flat to down.
Per KRO's 2024 annual report: "Chemours has approximately one-half of total North American TiO2 production capacity and is our principal North American competitor. LB Group previously announced its plans to add an additional 200,000 tons of chloride process capacity which we expect will be added incrementally over the next several years. However, several of our competitors have recently closed or announced plans to close facilities or otherwise reduce capacity, including Chemours which closed its Taiwan facility with an estimated 160,000 tons of chloride process capacity in 2023 and Venator which announced plans in 2024 to close its Duisburg, Germany facility with an estimated 50,000 tons of sulfate process capacity. In addition, in 2024 we closed our sulfate production line in Varennes, Canada. The TiO2 industry is characterized by high barriers to entry consisting of high capital costs, proprietary technology and significant lead times required to construct new facilities or to expand existing capacity. Therefore, over the past ten years, we and our competitors increased industry capacity through debottlenecking projects; however, this increase only partly compensated for the shut-down of various TiO2 plants throughout the world. Other than through debottlenecking projects and the LB Group expansion mentioned above, we do not expect any significant efforts will be undertaken by us or our principal competitors to further increase capacity and we believe it is unlikely any new TiO2 plants will be constructed in Europe or North America for the foreseeable future. If actual developments differ from our expectations, the TiO2 industry and our performance could be unfavorably affected."
Chinese Producers of TiO2
China is the elephant in the room. As mentioned above they have significant competitive advantages.
LB Group appears to have a competitive advantage over the rest. It has:
- 50% of the production costs of competitors. Lower labor, environmental, litigation costs.
- A dominant position in the asian market.
- Production co-located near mines and with lower transportation costs to Asian markets.
- Lower Chinese energy costs.

Western TiO2 producers have steadily been losing market share to Chinese producers. This is due to their competitive production costs.
"According to recent customs data, China's cumulative titanium dioxide export from January to December 2024 reached approximately 1,901,700 tons, increasing by about 260,000 tons or 15.84% over the previous year. The Others 9% Ink 4% Papermaking 7% Plastics 22% Paint 58% Industrial coating 9.28% Building coating 23.78% Auto coating 8.12% Protective and packaging coating 16.82% Full Text of 2024 Annual Report of LB Group Co., Ltd. 18 export destinations were concentrated in Asia and Europe, with Asia accounting for about 55%, the Middle East and Africa for about 15%, and Europe for about 12%. China's titanium dioxide export in 2024 was expected to maintain steady growth, with Southeast Asia, India, and the Middle East being the core incremental markets, driven by regional economic vitality and infrastructure demand while reinforcing China's pivotal role in the global supply chain." - LB Group annual report 2024.
Most Chinese exports go to destinations that are not in Europe or North America so protectionism in those countries seems to be working for now.

Capacity in 1000 metric tons according to USGS reports 2015-2024
KRO and CC are competitive because western governments have pursued antidumping duties against LB Group. LB Group specifically faces an EU duty of €0.74 per kg (740 euros per tonne) reuters.com, equivalent to roughly $800 per ton tariff; Brazil and India have similar policies.
Notably, in the United States, the core protection for TiO₂ is the 6% MFN tariff, in addition Section 301 tariffs implemented in 2025 add an additional 22%.
Also of note, in 2014 Charles Liew stole Dupont's (now Chemours) chloride production method for TiO2, since then Chinese companies have built chloride production plants. Before 2014 China had virtually no production using the chloride method. Now they produce 700k tons a year.
In recent earnings calls CC and TROX have mentioned significant potential tailwinds from this policy. However, China does continue to gain market share in non-protected markets.
All western TiO2 producers have stated that China is not a major competitive threat to their operations due to being primarily producers of low quality TiO2 produced using the sulfur method, and so far they have held up pretty well all things considered .
A few recent quotes by industry management on China.
"So our view is high grade imports into China are not necessarily being substituted by Chinese producers, but the demand is being impacted by where those products go into in terms of high end furniture and laminates for export, which are also down – tied to both a weaker economy in Europe and weaker construction in North America."
"Analyst: Lomon has added a few hundred thousand tons of chloride-based TiO2 capacity. Do you think that that's going to the overall Asian markets? Or will it stay in China? Or how do you see the industry being affected by a new chloride-based TiO2 competitor in size?
Denise Dignam (CEO): It's true. We see in the numbers, the exports of -- the China exports are increasing. One of the things to note is the weakness of the domestic market. And I think that gives customers pause, relative to long-term reliability, stability of supply. That is still a very, very key value proposition is the trust and confidence of customers that you're going to be able to service them day in, day out, reliably with high quality."
--Chemours CEO Q4 2023
"Analyst: And have you seen any idling capacity in China yet?
John Romano (CEO): I would say, yes. We've seen some plants pull back. Like, when John mentioned sulfur prices had gone up 40%, that was largely focused on Europe, I mean, China. And we have an asset over there. So, we have a very good window on what's happening in China, because we have an asset. It's not a large one. China is only 5% of our volume globally, and the majority of what we produce there, we sell in China.
But, I think that, there has been some move. Long-term closing of sulfate plants, I wouldn't say, there's been a lot yet, but there's been other reductions in volume. And I think it's important to kind of look at that. Normally, when you go through a downturn, you'll get to the bottom of the downturn and the market recovers before you see a lot of assets close. This market has been a lot different than that. The tail has been much longer.
We continually say that, although the tail's been long, definitively, we can say the market will recover. There's been no paradigm shift. But, there's been a lot more assets that have closed. We closed the plant. Most of our western competitors have closed either one or multiple plants. There's two Japanese plants that have been outlined as closing to 80,000-ton sulfate facilities in late in '25 and early in '26. So as the market recovers, it's not only China's volume that could be impacted. It's the overall volume that won't be available to supply the demand.
So, again, we're not looking for a demand to recover back to where we were in 2021. But getting back to 2019 levels, we believe is very doable, and there'll be a smaller base to support it, which would help with our margins."
- John Romano (CEO) Tronox earnings call, q1 2025
"We also believe that Chinese capacity, while publicly announced, will not only (sp?) materialize in years ahead. This belief is based on Chinese producer awareness around the overcapacity and the challenges as to where these producers can sell products with key markets pursuing more fair trade regulations.
This is further supported by a combination of other factors such as plant idling and shutdowns, a persisting weak domestic market, along with impacts from higher sulfate pricing. To this, we are anticipating Chinese lower production levels in 2025, breaking a 10-year trend of increasing output. As we continue to pursue opportunities in this transitioning global TiO2 landscape, it brings back the importance of driving our low-cost TiO2 position globally.
In TT, (titanium technologies) we don't expect much impact from tariffs considering that TiO2 is excluded, but continue to pursue efforts to protect U.S. TiO2 production and the markets we sell into.
We also do not see any significant impact to TT raw material pricing due to tariffs."
- Denise Dignam, CEO Chemours, q1 2025
Unit Economics of TiO2
To give you a tangible example of the unit economics of TiO2 production (using the chlorine method), I examined Kronos.
Fixed costs
2022-2024 KRO did not operate at full capacity, and stated the unallocated fixed costs those years. Using that data we can work back to estimate the fixed costs of running the plants. Unabsorbed fixed costs / unutilized % = total fixed costs.
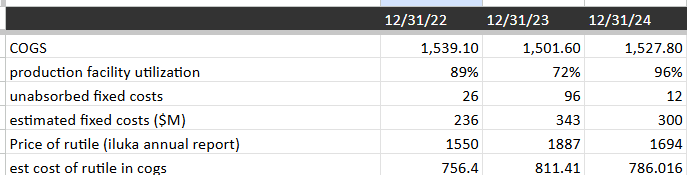
So fixed costs are about 20% of COGS.
Variable Costs
On a pure chemical basis, the ratio of titanium in 95% rutile to titanium in TiO2 should be about 1:1, but we should account for processing inefficiencies. According to an industry review: ~3.5 million tonnes of TiO₂ are produced globally by the chloride route. This production consumes about 4.5 million tonnes of titania feedstock (like rutile, synthetic rutile, or titania slag) annually. From these figures we find that the implied feedstock-to-product ratio is roughly 4.5 / 3.5 or 1.3 tons of feedstock per ton of TiO₂.
Chlorine gas is used to convert titanium in the ore to titanium tetrachloride (TiCl₄), and by molecular mass approximately 0.4 tons of chlorine are required per ton of TiO₂ output. Petroleum coke serves as a reductant in the chlorination reaction, consumed at a rate of about 0.15 tons per ton of TiO₂. Once TiCl₄ is refined, it is oxidized using oxygen to produce TiO₂ and regenerate chlorine. This step consumes about 0.15 tons of oxygen. In addition to raw materials, significant energy is required throughout the process — for high-temperature chlorination, oxidation, and post-processing (drying, milling, packaging). Total energy should be 1.5-2.5 megawatt-hours per ton, depending on plant efficiency.
All together for 1 ton of TiO2 output we need the following inputs:
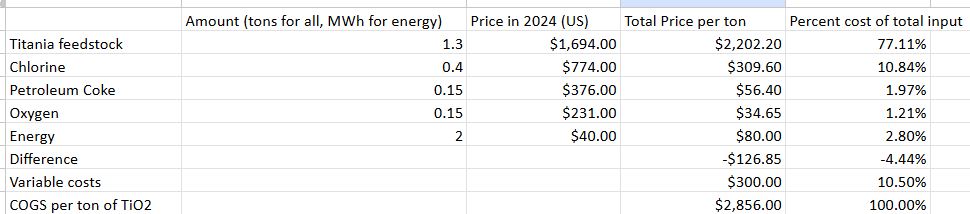
Note: Iluka's 2024 annual report (titania ore supplier) stated an average sales price of rutile of $1694/ton. The difference in my estimate and the actual COGS is likely a more efficient rate of titania feedstock conversion than I assumed in my model ~1.25.
Analysts say that feedstock ores across all companies and methods account for 30-40% of total TiO2 production costs. This is most likely true for vertically integrated producers like Tronox. Source: https://pmarketresearch.com/chemi/tio2-market/
TiO2 Producers Compared
Their lower production curves explain the improved margins of LB Group.
The EBITDA margins of the major TiO2 producers over time.
TROX has decent adjusted EBITDA margins but these have been reduced by restructuring charges, a damaged plant, high capex costs associated with the mines.

EBITDA of the major TiO2 producers over time.
2017-2018 was peak cycle, 2023-2024 was trough cycle. Considering that this is a mature industry with steady average margins, we can value these companies based on average adj ebitda over that time period. We can argue about whether these are cycles or just temporary margin pressures, where input increases and contracted selling prices are steady, or vice versa.
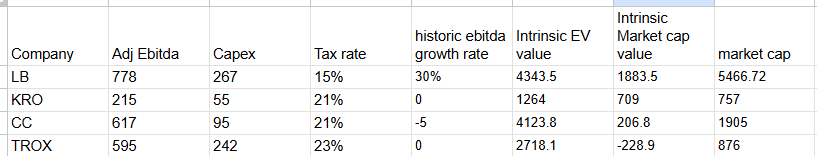
Valued using Greenwald's EPV ((EBITDA-CAPEX)*(1-tax rate)/WACC), with a WACC of 10%. (You can also think of this as a midcycle EBIT at a 10x multiple) All of the companies are fairly valued at best (KRO) and overvalued at most. Note that for CC this is just valuing the TiO2 division. There is roughly 200mn EBITDA-capex in the remaining company. That adds 1,600Mn to the market cap. And LB is pricing in its historically high growth rate of 30%.
If we apply a DCF to this, adding in changes in net working capital (average 24mn a year), a 2% growth rate, 15% discount rate, a terminal multiple of 10, then the market cap values calculated above should be roughly halved.
Feedstock Miners for TiO2
TiO2 is essentially process/enriched titanium ore. 90% of mined titanium goes into TiO₂ pigment. So you could think of the TiO2 industry as refiners of titanium.
TiO2 ore deposits are bountiful around the world.
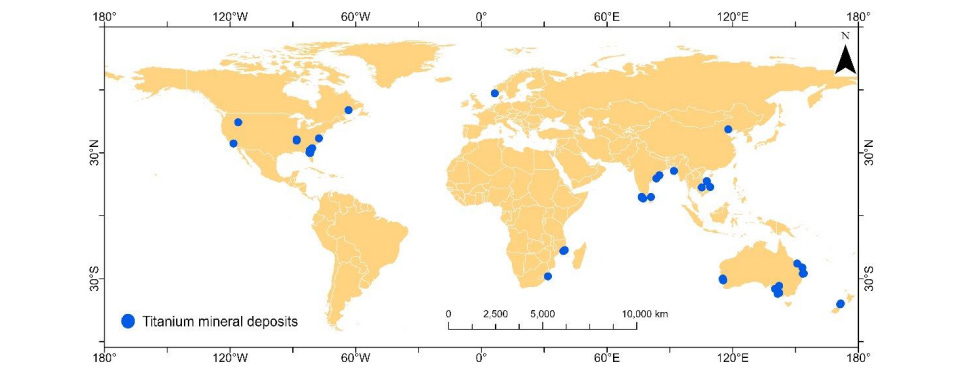
Major mining operations are located in Australia, South Africa and China.
Source: https://www.lneg.pt/wp-content/uploads/2022/07/CG22-04-2202-Subasinghe-and-Ratnayake.pdf
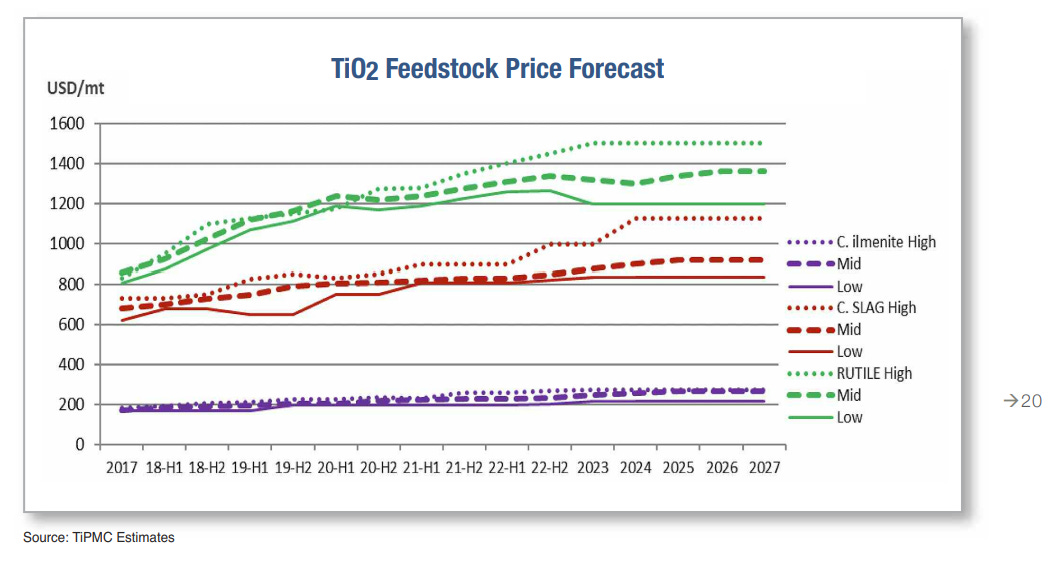
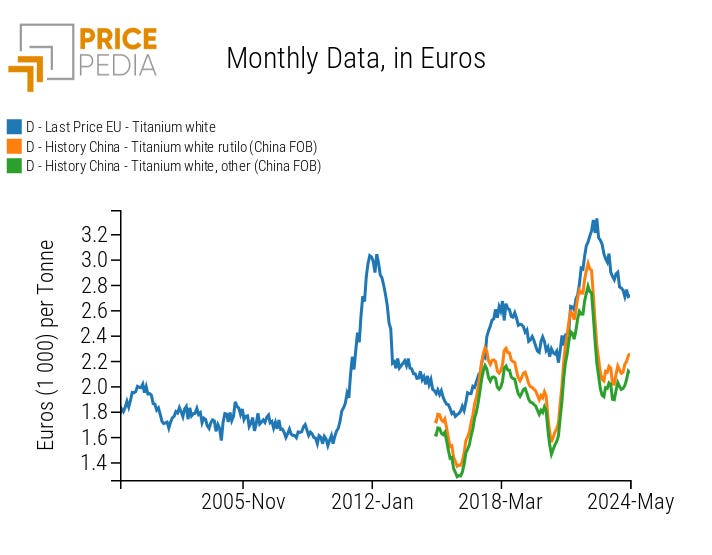
The cost of feedstocks used in the chlorination process have risen quickly from 2017-2023 due to constrained supply.
Rutile is being depleted:
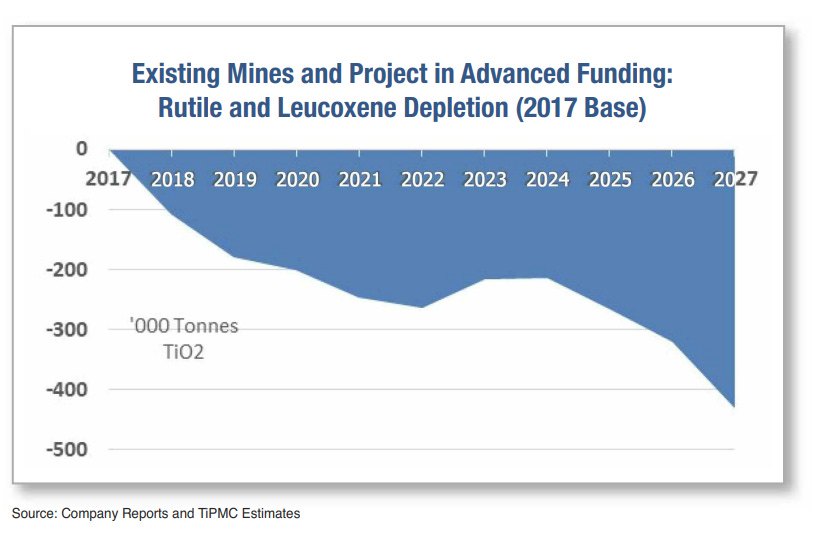
With little additional rutile supply expected to come online, suggesting that feedstock prices will remain high for the foreseeable future.
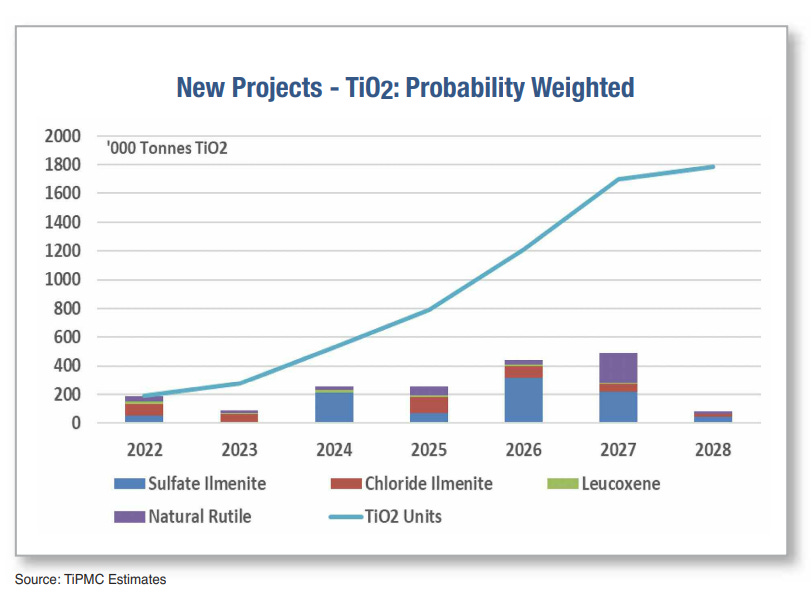
Source: https://www.tipmcconsulting.com/wp-content/uploads/2017/08/TiPMC_Feedstock_Forecast_Feb_2023.pdf
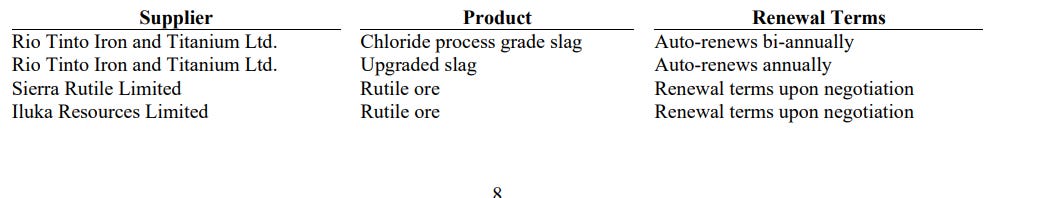
KRO buys its resources mostly from 3 suppliers.
Rio Tinto doesn't break out its titanium slag product revenues in its financial statement so I can not see pricing for that, but I can see changes in production. However Iluka Resources discloses its Rutile production and prices.
Low rutile ore availability means that even if end consumer demand increases, TiOs production volume may not be able to ramp up due to a supply constraints on ores, suggesting that any increase in end user demand would benefit TiO2 (rutile) ore miners more than TiO2 pigment producers.
Conclusion
Key takeaways for the industry:
1. TiO2 producers are essentially titania ore refiners, with most of their cost being ore.
2. TiO2 consumers have inelastic demand for the pigment. So the margins of the producers are stable over time, and they can earn consistent profits. That means as ore prices rise they can pass these costs to the consumer (with some lag time).
3. Significant excess capacity exists among TiO2 producers both globally and in the West. Even if demand for TiO2 caught up to GDP growth in the west, much of that demand would be buffered by that excess capacity, diminishing TiO2 producers upside.
4. Chinese competition is a major threat, as the low cost producer, they have strong margins and much growth potential. Among Western TiO2 producers, market share has slowly been whittled away, lost to Chinese competition. The only thing holding these competitors back is western anti-dumping measures, and occasional Chinese environmental crackdowns.
So if you accept that:
1. Western countries' anti dumping measures against Chinese competition will continue (limiting the existential competitive threat of Chinese production).
2. And due to excess capacity among producers upside is limited, as they will not be able to exercise pricing power.
Then you can value these companies as having a steady earnings power over the next 5-10 years with little risk. EPV is a good valuation method for that.
In valuation, the titanium segment of all of the western unintegrated companies (KRO, CC) is a slow, low earnings, boring businesses, that appears to be fairly valued. Because they are demand takers of ore prices, they have limited upside in a demand rebound. LB Group with its competitive advantages is growing at 30% a year, and so is priced at a premium, if western protectionism is effectively enforced then LB Group's multiple may contract. TROX and Iluka present interesting opportunities on a demand rebound.
A great write-up on KRO https://valueinvestorsclub.com/idea/KRONOS_WORLDWIDE_INC/6847802931
Interesting context for TROX
https://valueinvestorsclub.com/idea/TRONOX_HOLDINGS_PLC/3670542007
Considering the value of CC's refrigerant business considering regulatory changes and data center potential. https://valueinvestorsclub.com/idea/CHEMOURS_CO/2642600503